
Recipe Management Basics: 4 Stages to Improving Margins
- COGS-Well Team

- Oct 22, 2025
- 3 min read
Updated: 3 days ago
Recipes can be more than just a set of instructions – when added to an inventory and recipe management system, they become a powerful tool for increasing insights and improving profitability.
Once you've mastered Inventory Control Basics, the next step is applying that data to your recipes. This article will cover the four stages of Recipe Management.
Stage One - Prepared Item Recipes:
Prepared items or “Prep Items” are recipes that you prepare in advance and are often made in batches – think sauces, salad dressings, pre-cut vegetables, or trimmed and portioned proteins. This example shows the ingredient screen for a Salsa Prep Item:

The best practice is to start recipe management by creating recipes for your Prep Items. The benefits are threefold:
Workflow Benefit: Starting with Prep Items ensures that when you build a final menu item recipe (like a Fiesta Omelet), the “Salsa” will be a selectable ingredient.
Financial Benefit: You can count unused batches of your Prep Items as part of your ending inventory valuation, thus getting a credit to reduce your Cost of Goods Sold (COGS).
Operational Benefit: Some systems, like COGS-Well, provide the option to track your preparation and to even suggest the items and quantities to prepare based on hand levels, projected usage, and shelf life.
Stage Two - Menu Item Recipes:
Once your prep items are defined, you can build recipes for your menu items (items that you sell). A quality recipe management system will import these items, along with their price and sales category, from your POS.
Below is an example of a recipe for a California Burger:

High Impact Items: If your time/resources are limited, start with your higher cost menu items, such as your entrees. Or, your recipes with fewer ingredients, such as your wines.
Key Items: Another approach is to only add your most expensive or highest-usage ingredients to the items they are used in. This will allow you to perform theoretical versus actual (TvA) usage for your “key” items without entering every pinch of salt.
Stage Three - Recipe Costing and Modeling (The “What-If” Game):
Menu Item Modeling is the practice of trying to optimize the profitability of a menu item. Most systems calculate a Theoretical cost in dollars and as a percentage of the sales price. Advanced systems like COGS-Well allow you to model new menu items or changes to existing ones in real time. Below is an example of a Menu Modeling display for a California Burger menu item:
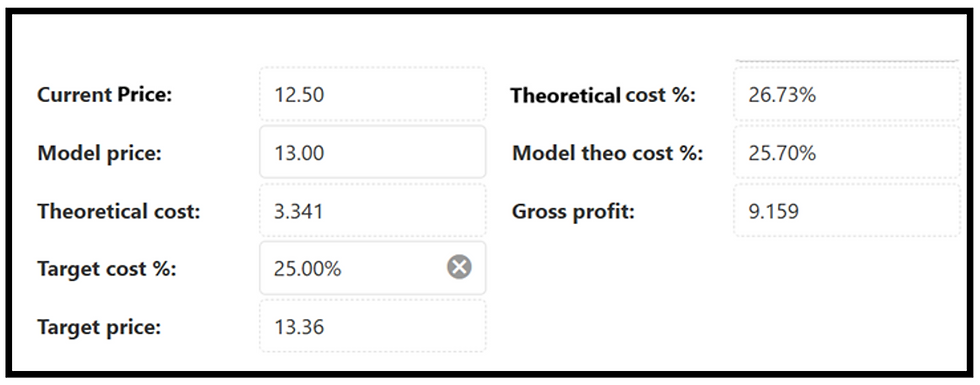
Price Adjustments: This item’s target cost % is 25%, but its theoretical cost percentage is 26.73%. The system shows the target price should be $13.36. A new price can also be entered in the Model Price to view the impact of a price change.
Target Cost %: The Target Cost % can be changed, and a new Target Price will be displayed.
Ingredient Changes: Ingredients in the recipe can be substituted, or portions can be changed to see the impact on the Menu Modeling display.
Stage Four - Menu Analytics:
The final stage of Recipe Management is Menu Analytics, which integrates your menu item recipes with your POS sales mix data. The result is combining the popularity of each menu item with its profitability (gross margin) to determine where you are making money and where changes are needed. This is called “Menu Engineering,” and an example of a Menu Engineering report is shown below.

Stars: Items with high popularity, high profitability. Protect these!
Plow Horses (Workhorses): Items with high popularity but low profitability. These are prime candidates for price adjustments or portion modeling to move them to “Star” status.
Challenges: Items with high profitability but low popularity. These may need better placement on the menu or server incentives.
Dogs: Items with low popularity and low profitability. These are often candidates for removal.
Pro Tip: Always focus on profit contribution dollars. While percentages are important for benchmarks, you take dollars to the bank—not percentages.
The Digital Recipe Book - Preparation Instructions:
A professional recipe management system should also serve as your single source of truth for the kitchen and for cost analysis. By adding preparation steps, photos, and equipment requirements, you eliminate the need for traditional recipe books. In this example, preparation instructions have been added to a Breakfast Burrito Recipe:

Recipe Viewer: Using a recipe viewer on a tablet at prep stations is another benefit of adding preparation instructions. It helps your team ensure the right ingredients, portions, and preparation methods are always being utilized.
Summary:
While creating recipes requires an initial investment of time, the process is streamlined when using an inventory system where ingredients and costs are already live. Whether you start with simple prep items or scale to full menu analytics, the resulting insights are the most effective way to protect your bottom line and ensure long-term profit mastery.


